Oct 21, 2026 · 9 min read
ThinkingCap-NVIDIA-Nemotron-3.5-Lightning-30B-A3B: up to 31% and on average 23% less thinking, comparable benchmark accuracy
TL;DR
This is the third model in the ThinkingCap series. Building on our two earlier releases, we reduced how much NVIDIA's Nemotron-3.5-Lightning-30B-A3B thinks, without compromising the quality of its answers.
- Up to 31.3% reduction in thinking tokens, on average 22.8% measured across eleven benchmarks, for 0.88pp of accuracy
- Up to 2.3× more requests completed in multi-user serving, compared to the original Nemotron
- Same sampling settings (thinking on, temperature 1.0, top_p 0.95), same serving stack (vLLM), drop-in replacement
Want a variant tuned for your own workload, proven on your own evals, or access to our better internal model? enterprise@bottlecapai.com
Our third ThinkingCap
We have published two token-efficient models so far, ThinkingCap-Qwen3.6-27B and ThinkingCap-Qwen3.8-27B, both trained from a Qwen checkpoint. A fair question is whether the same efficiency work applies to other models too.
Nemotron-3.5-Lightning-30B-A3B is another widely used open model, and a different lineage: NVIDIA's own pretraining, its own post-training and its own reasoning style. With this release we show that our optimisations work on other model families too.
Video comparison of the original model and the ThinkingCap version, prompted with the same input.
Both models run on the same hardware and use the same inference settings.
Shorter thinking, more finished work
On a busy server handling many concurrent requests, fewer thinking tokens pay off twice. Each task finishes sooner, and each running sequence uses less KV cache, so fewer requests get evicted and more can run side by side.
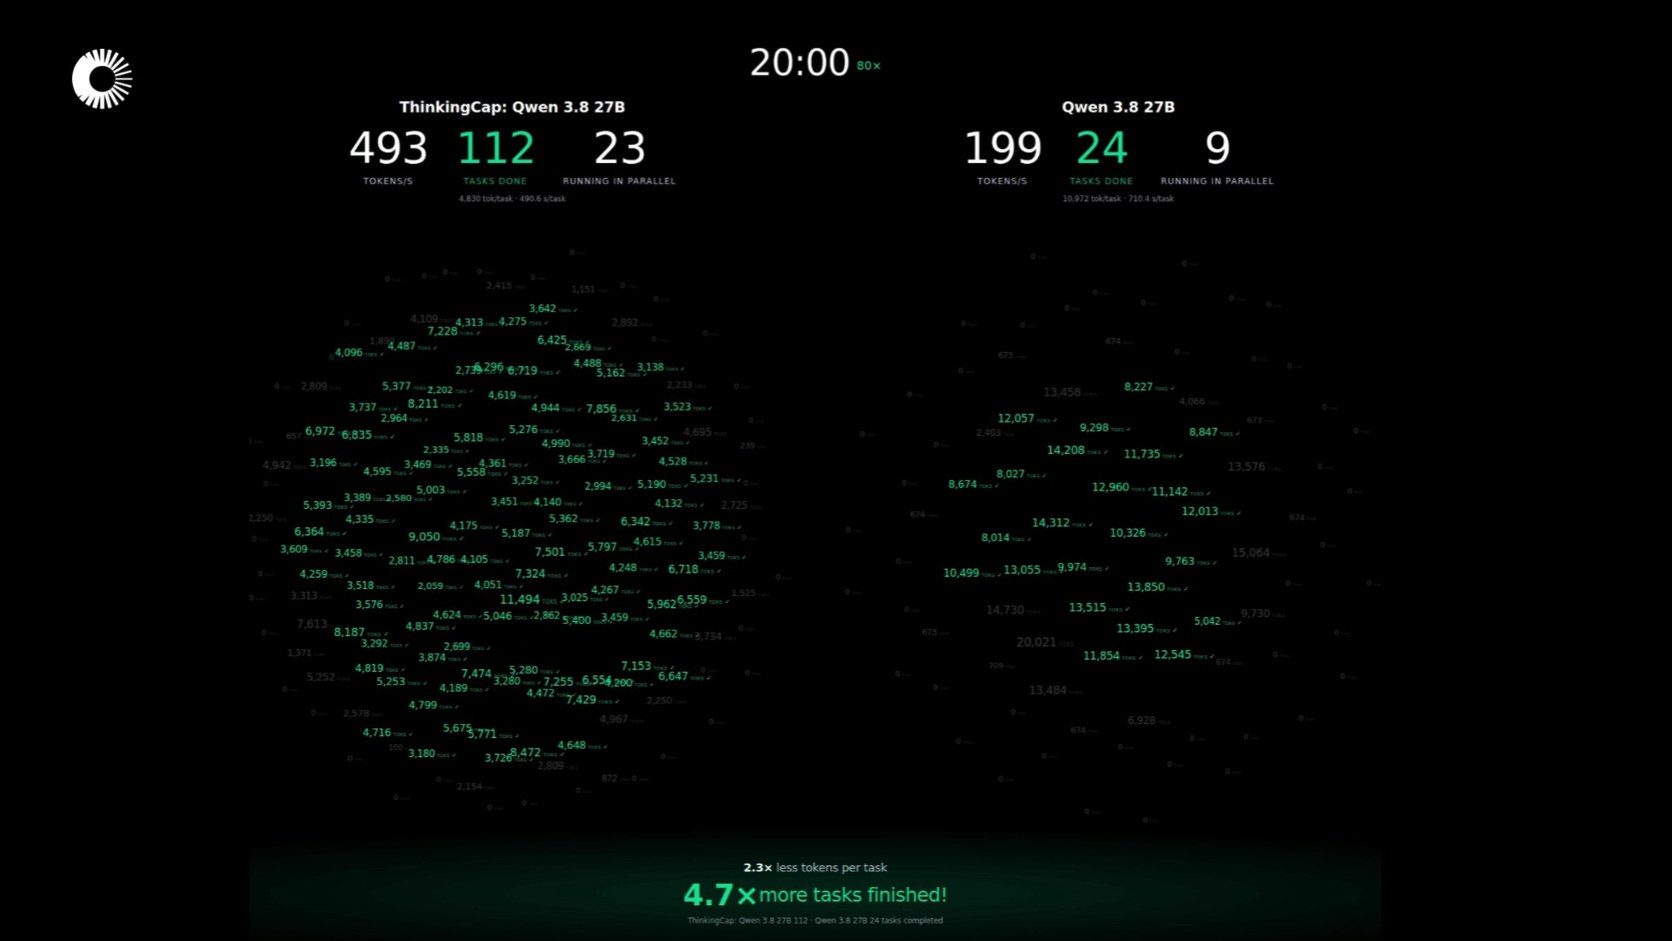
Visualisation of an example scenario where both models receive an unlimited stream of requests, showing how many tasks each can complete within a given time window. The Thinkingcap version uses fewer reasoning tokens, resulting in a smaller KV cache footprint and allowing more tasks to run in parallel.
Both models run on identical setups and get the same chemistry problem, with 20 minutes to solve it. ThinkingCap uses 23% fewer thinking tokens and completes 25 tasks in that time, compared to 11 for the base model: 2.3× as many. We explain why in Halve the thinking trace length, quadruple the work.
The training objective
We start with NVIDIA-Nemotron-3.5-Lightning-30B-A3B. The goal is to spend fewer tokens getting to the answer, and change nothing else: preserve the knowledge, reasoning ability, answer quality, instruction following and safety behaviour.
Results
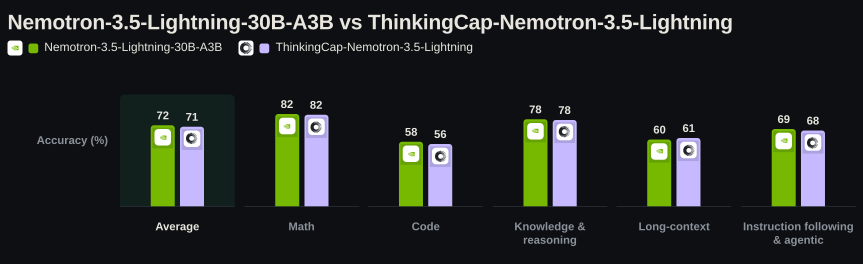
Accuracy per task family, original Nemotron-3.5-Lightning-30B-A3B against the ThinkingCap checkpoint
Accuracy tracks the original model closely in every family. Knowledge and reasoning costs least, 0.51pp, and long-context comes out a point ahead. The two that cost most are code, 1.83pp, and instruction following and agentic, 1.62pp. Averaged over all eleven benchmarks the cost is 0.88pp.
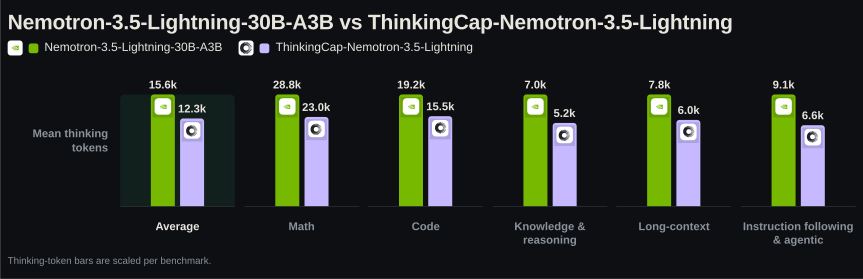
Mean thinking tokens per task family, original against the ThinkingCap checkpoint
The thinking is where the change is, and every family gets shorter. Knowledge and reasoning reduces the most, 27.8%, then instruction following and agentic at 24.3% and long-context at 22.6%; code reduces the least at 16.8%. Averaged over the eleven benchmarks it is 22.8%.
| Benchmark | Accuracy (base) | Accuracy (ours) | Δ accuracy | Mean thinking tokens | Δ mean thinking | Matched Δ thinking | Median thinking tokens | Δ median thinking | Mean answer tokens | Δ mean answer | Trunc. % | Looping % | Seeds |
|---|---|---|---|---|---|---|---|---|---|---|---|---|---|
| Math | |||||||||||||
aime26 | 87.45% ±0.89 | 86.41% ±1.06 | -1.04pp | 23295 → 18106 | -22.3% | -26.7% | 15632 → 10686 | -31.6% | 40 → 36 | -9.7% | 0.1 → 0.0% | 0.1 → 0.0% | 64 |
hmmt_nov25 | 84.48% ±1.03 | 84.22% ±1.16 | -0.26pp | 29400 → 22292 | -24.2% | -24.2% | 24431 → 17405 | -28.8% | 52 → 48 | -7.0% | 0.3 → 0.1% | 0.3 → 0.1% | 64 |
hmmt_feb26 | 75.09% ±1.08 | 74.20% ±1.03 | -0.90pp | 33845 → 28469 | -15.9% | -19.1% | 30540 → 23061 | -24.5% | 56 → 48 | -15.8% | 0.1 → 0.0% | 0.1 → 0.0% | 64 |
| Code | |||||||||||||
livecodebench | 76.64% ±0.74 | 75.46% ±0.89 | -1.18pp | 28812 → 22590 | -21.6% | -28.9% | 24559 → 14222 | -42.1% | 443 → 432 | -2.3% | 0.2 → 0.1% | 0.3 → 0.0% | 16 |
scicode | 38.37% ±1.49 | 35.89% ±0.96 | -2.47pp | 9641 → 8481 | -12.0% | -13.5% | 6356 → 5286 | -16.8% | 861 → 753 | -12.5% | 0.1 → 0.0% | 0.0 → 0.0% | 8 |
| Knowledge & reasoning | |||||||||||||
gpqa_diamond | 76.03% ±0.67 | 74.78% ±0.77 | -1.25pp | 14688 → 11157 | -24.0% | -28.0% | 7199 → 4079 | -43.3% | 1 → 1 | -4.1% | 0.2 → 0.1% | 0.1 → 0.1% | 32 |
mmlu_pro | 81.65% ±0.69 | 81.35% ±0.70 | -0.30pp | 4327 → 3026 | -30.1% | -27.5% | 975 → 734 | -24.7% | 1 → 1 | +0.0% | 0.0 → 0.0% | 0.0 → 0.0% | 1 |
mmmlu | 76.46% ±0.83 | 76.47% ±0.83 | +0.01pp | 1937 → 1371 | -29.2% | -27.3% | 827 → 631 | -23.7% | 1 → 1 | +0.0% | 0.3 → 0.2% | 0.0 → 0.0% | 1 |
| Long-context | |||||||||||||
aa_lcr | 59.94% ±2.39 | 60.94% ±2.07 | +1.00pp | 7784 → 6027 | -22.6% | -22.6% | 5501 → 4284 | -22.1% | 392 → 374 | -4.5% | 1.4 → 0.8% | 0.2 → 0.2% | 16 |
| Instruction following & agentic | |||||||||||||
ifbench | 71.40% ±0.98 | 69.29% ±1.36 | -2.10pp | 12991 → 8923 | -31.3% | -30.9% | 4491 → 3066 | -31.7% | 359 → 322 | -10.3% | 2.1 → 1.2% | 2.1 → 1.3% | 16 |
tau2 | 67.23% ±1.47 | 66.08% ±1.36 | -1.14pp | 5294 → 4377 | -17.3% | -16.1% | 4128 → 3462 | -16.1% | 2548 → 2414 | -5.3% | 0.0 → 0.0% | 0.0 → 0.0% | 16 |
| Average (11 benchmarks) | 72.25% | 71.37% | -0.88pp | 15638 → 12256 | -22.8% | -24.1% | 11331 → 7902 | -27.8% | 432 → 403 | -6.5% | 0.4 → 0.2% | 0.3 → 0.2% | |
Every row is the original BF16 model against the ThinkingCap checkpoint, run on the same harness with the same settings on the same questions. Accuracy is the mean over seeds, ± the 95% confidence interval from the spread between them. Every cell in the last row is an average across the eleven benchmarks, each counting once. On τ²-bench the thinking tokens are per task, summed across the rollout's turns, rather than per response. Column definitions are in Evaluation methodology.
Every one of the eleven gets shorter. The deepest cuts are IFBench (−31.3%), MMLU-Pro (−30.1%) and MMMLU (−29.2%); the shallowest SciCode (−12.0%), HMMT Feb 26 (−15.9%) and τ²-bench (−17.3%). Median traces fall further than means across the suite (−27.8% against −22.8%), which says the compression is spread across questions rather than coming from a few runaway generations being cut. On accuracy, most of the results are within noise: on seven of the eleven the gap is smaller than the run-to-run spread.
Two benchmarks come through with no cost at all — AA-LCR gains a point and MMMLU is flat — and two more land within a third of a point of the original model, HMMT Nov 25 and MMLU-Pro. The expensive end is SciCode (−2.47pp) and IFBench (−2.10pp).
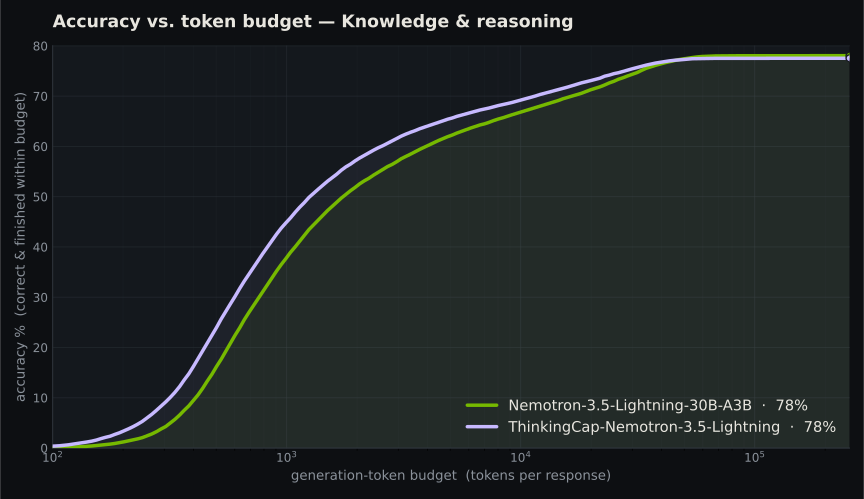
Accuracy against the thinking-token budget, both models
Read left to right, this is the question a deployment actually asks: for a given token budget per question, how much accuracy do you get? ThinkingCap's curve sits above the original model's through the whole middle of the range — the same accuracy for a smaller budget — and the two converge once the budget is wide enough that neither model is constrained by it.
Evaluation methodology
Reasoning models are noisy to evaluate. At the recommended temperature of 1.0 both the content and the length of a response move run to run, so a single seed tells you very little. Everything below is multiple seeds per benchmark, with accuracy reported as the mean and a 95% confidence interval across seeds.
Both sides are the same run. The original model and ours were evaluated by the same harness, on the same hardware, with identical sampling and serving settings. The original model was measured by us, not quoted from published figures. The configuration:
- Harness — our internal evaluation suite, running both models on vLLM 0.27.1.
- Hardware — NVIDIA RTX PRO 6000.
- Context — generation capped at 253,952 tokens per response; 65,536 on AA-LCR and 65,536 per turn on τ²-bench. The caps are far above what either model actually uses.
- Sampling — thinking on, temperature 1.0, top_p 0.95, identical for both. Ours inherits NVIDIA's recommended preset for this model, so no part of the comparison is a decoding change.
- SSM cache — vLLM's float32 default, not the model card's
--mamba-ssm-cache-dtype float16with stochastic rounding. Those lengthen the original model's reasoning on AIME 2026 by about 10% at unchanged accuracy, which would flatter every reduction in this post by inflating the baseline. - Accuracy — the mean across seeds with a 95% confidence interval. MMLU-Pro and MMMLU run at a single seed and carry no interval: at 12,032 and 9,996 questions one pass is already tighter than the 64-seed AIME row.
- Seeds — 64 on AIME 2026, HMMT Feb 26 and HMMT Nov 25; 32 on GPQA-Diamond; 16 on LiveCodeBench, AA-LCR, IFBench and τ²-bench; 8 on SciCode; 1 on MMLU-Pro and MMMLU.
- Question sets — the full set on every benchmark, with two exceptions fixed before the runs and identical for both models: MMMLU is a stratified sample of 9,996 of its 196,588 questions, 714 in each of its 14 languages, drawn once under a fixed seed; LiveCodeBench v6 is the 175 problems of the newest release.
- Scoring — exact match on the extracted answer, except LiveCodeBench and SciCode, where the generated code is run against the problem's tests; IFBench, scored by its programmatic verifiers at prompt-level strict; and τ²-bench and AA-LCR, which are Gemini-judged. τ²-bench also runs against a Gemini-simulated user and is reported as the unweighted mean over its airline, retail and telecom domains.
What the columns mean
-
Seeds — independent sampling runs of the benchmark.
-
Accuracy (base) / Accuracy (ours) — as above; Δ accuracy is the difference between them, in percentage points.
-
Δ mean thinking — the headline: the change in thinking tokens, totalled across the benchmark and divided by its question count, so a long question weighs more than a short one.
-
Matched Δ thinking — the change in thinking tokens, paired on the question and aggregated as a geometric mean of the per-question ratios. Each side's token count is averaged over its seeds first, so a question has one value for the base model, , and one for ours, ; the column is then
over the questions both models answered. A question where has no logarithm and drops out of this column alone.
-
Thinking tokens are the tokens before the reasoning closes, answer tokens those after it. Each is written
base → ours, and the Δ beside one is that benchmark's own percentage change. The median columns say the same thing about the typical question rather than the average one. -
Truncated % — the share of responses whose thinking never closed, which score zero. Looping % — the share caught by a compression-based loop detector.
Get the model
You can find the model here: bottlecapai/ThinkingCap-NVIDIA-Nemotron-3.5-Lightning-30B-A3B
Contact us
Have any questions, or a workload you want this run against?
Send us a mail at hey@bottlecapai.com