Sep 22, 2026 · 12 min read
ThinkingCap-Qwen3.8-27B: the same answers, 37% less thinking
TL;DR
The second model in our ThinkingCap series. We took Qwen3.8-27B and cut how much it thinks, without changing the quality of the answers.
The result, measured across all twelve benchmarks we run:
- 37.2% fewer thinking tokens on average, for 0.86pp of accuracy
- Much more focus this time on the harder benchmarks: math, reasoning, long-context and agentic
- Long-context retrieval got better, and agentic benchmarks now drop by under a percentage point on average, far less than in our first release
- Same sampling settings, same serving stack, drop-in replacement
- No change to answer style or length
The model is on HuggingFace at bottlecapai/ThinkingCap-Qwen3.8-27B, with GGUF, FP8 and NVFP4 builds alongside it. Drop it in where you run the base model today.
Want a variant fine-tuned for medium or low effort on your workload, proven on your own evals, or access to our better internal model? enterprise@bottlecapai.com
Overthinking is an efficiency problem
Reasoning models are not always efficient with their thinking tokens. A model will sometimes spend far more of them on a question than it needs, and those extra tokens often do not change the answer it arrives at. Optimising that inefficiency — keeping the reasoning that does the work and slashing the part that does not — is what this ThinkingCap series is for.
The first model in the series, based on Qwen3.6-27B, showed the approach holds outside a benchmark table. The feedback was that the shorter traces genuinely helped in the places people had put the model to work: the same jobs getting done, for less time and less money.
This release carries that work onto a newer base. Qwen3.8-27B is the model people asked us for next.
The objective
We started from Qwen3.8-27B (Qwen Team, 2026), and the target was the amount of tokens spent getting to the answer. Less number of thinking tokens to get the same answer.
The aim was deliberately conservative. We did not try to make the model smarter, teach it anything new, or change how it talks. Knowledge, reasoning ability, answer quality, instruction following and safety behaviour were all meant to come through untouched.
Results
At the highest reasoning effort (xhigh)
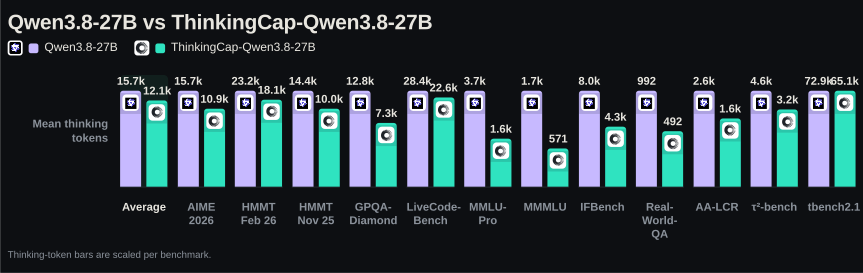
The reduction is broad rather than concentrated. Every benchmark gets shorter, and the ones that were thinking hardest give up the most in absolute terms — GPQA-Diamond drops from roughly 12,800 thinking tokens to 7,300, MMMLU from 1,656 to 571.
The usual price of making a model think less is accuracy. This time we put much more effort into keeping that price small.
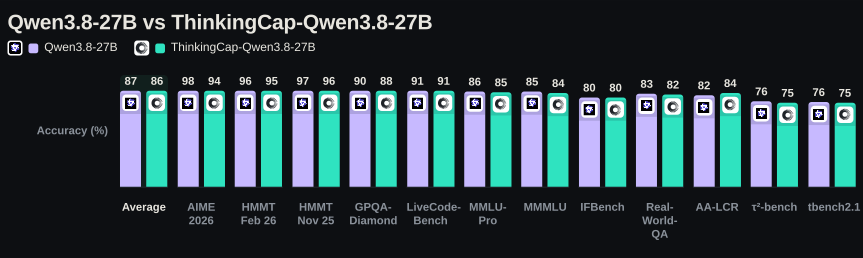
Accuracy tracks the base model closely. Ten of twelve benchmarks move by less than two points, one moves up, and the macro-average cost is under a point.
| Benchmark | Accuracy (base) | Accuracy (ours) | Δ accuracy | Mean thinking tokens | Δ mean thinking | Matched Δ thinking | Median thinking tokens | Δ median thinking | Mean answer tokens | Mean total tokens | Δ mean total | Median total tokens | Δ median total | Truncated % | Looping % | Seeds |
|---|---|---|---|---|---|---|---|---|---|---|---|---|---|---|---|---|
aime26 | 98.13% ±0.74 | 94.27% ±1.47 | -3.85pp | 15663 → 10934 | -30.2% | -42.5% | 9601 → 4973 | -48.2% | 7 → 7 | 15673 → 10943 | -30.2% | 9611 → 4983 | -48.2% | 0.0 → 0.1% | 0.0 → 0.1% | 32 |
hmmt_feb26 | 95.83% ±1.16 | 94.70% ±1.50 | -1.14pp | 23211 → 18099 | -22.0% | -31.2% | 13942 → 9407 | -32.5% | 11 → 12 | 23225 → 18113 | -22.0% | 13954 → 9419 | -32.5% | 0.2 → 0.0% | 0.2 → 0.0% | 16 |
hmmt_nov25 | 97.08% ±1.43 | 96.04% ±2.17 | -1.04pp | 14443 → 10037 | -30.5% | -35.0% | 8636 → 5677 | -34.3% | 8 → 8 | 14454 → 10048 | -30.5% | 8648 → 5689 | -34.2% | 0.0 → 0.2% | 0.0 → 0.2% | 16 |
gpqa_diamond | 89.93% ±0.70 | 88.04% ±1.09 | -1.89pp | 12772 → 7267 | -43.1% | -59.3% | 4054 → 1048 | -74.2% | 1 → 1 | 12776 → 7271 | -43.1% | 4058 → 1051 | -74.1% | 0.1 → 0.1% | 0.1 → 0.0% | 16 |
livecodebench | 91.14% ±1.11 | 91.21% ±1.28 | +0.07pp | 28395 → 22645 | -20.3% | -36.0% | 16524 → 9978 | -39.6% | 496 → 477 | 28894 → 23125 | -20.0% | 16924 → 10377 | -38.7% | 0.1 → 0.0% | 0.1 → 0.0% | 8 |
mmlu_pro | 85.54% | 84.67% | -0.86pp | 3725 → 1591 | -57.3% | -64.4% | 439 → 164 | -62.6% | 1 → 1 | 3729 → 1595 | -57.2% | 443 → 168 | -62.1% | 0.1 → 0.0% | 0.0 → 0.0% | 1 |
mmmlu | 85.38% | 84.09% | -1.29pp | 1656 → 571 | -65.5% | -55.6% | 291 → 153 | -47.4% | 1 → 1 | 1660 → 575 | -65.4% | 295 → 157 | -46.8% | 0.1 → 0.0% | 0.0 → 0.0% | 1 |
ifbench | 79.75% ±0.63 | 79.71% ±0.60 | -0.04pp | 7961 → 4266 | -46.4% | -56.4% | 3844 → 1536 | -60.0% | 293 → 202 | 8257 → 4471 | -45.8% | 4163 → 1745 | -58.1% | 0.5 → 0.2% | 0.3 → 0.2% | 16 |
realworldqa | 83.25% ±0.73 | 82.34% ±0.71 | -0.92pp | 992 → 492 | -50.4% | -37.7% | 157 → 108 | -31.6% | 1 → 1 | 996 → 496 | -50.2% | 161 → 112 | -30.4% | 0.0 → 0.0% | 0.0 → 0.0% | 8 |
aa_lcr | 81.75% ±1.07 | 84.00% ±0.77 | +2.25pp | 2550 → 1565 | -38.6% | -36.7% | 1319 → 836 | -36.6% | 184 → 102 | 2738 → 1670 | -39.0% | 1511 → 935 | -38.1% | 0.0 → 0.0% | 0.0 → 0.0% | 8 |
tau2 | 76.16% ±1.52 | 75.15% ±1.67 | -1.01pp | 4584 → 3168 | -30.9% | -29.4% | 3646 → 2578 | -29.3% | 1851 → 1560 | 6435 → 4727 | -26.5% | 5123 → 3894 | -24.0% | 0.0 → 0.0% | 0.0 → 0.0% | 8 |
tbench2.1 | 75.84% ±4.26 | 75.28% ±4.38 | -0.56pp | 72871 → 65092 | -10.7% | -17.3% | 23327 → 18924 | -18.9% | 17687 → 18670 | 90557 → 83763 | -7.5% | 33248 → 25656 | -22.8% | 5.1 → 3.4% | 0.0 → 0.0% | 4 |
| average (12 benchmarks) | 86.65% | 85.79% | -0.86pp | 15735 → 12144 | -37.2% | -41.8% | 7148 → 4615 | -42.9% | 1712 → 1754 | 17450 → 13900 | -36.5% | 8178 → 5349 | -42.5% | 0.5 → 0.3% | 0.1 → 0.0% | — |
Every benchmark at reasoning_effort=xhigh: how accurate each model is, and how much reasoning it spent getting there. What each column means, and the settings both models ran under, are in Evaluation methodology below.
Across the twelve benchmarks the model spends 37.2% fewer thinking tokens for 0.86pp of accuracy. Long-context retrieval gets better: AA-LCR gains 2.25pp, clear of the base model's confidence interval. The agentic benchmarks hold up too — Terminal-Bench 2.1 keeps its accuracy, and τ²-bench gives up about a point.
The shortening is substantial on most benchmarks: nine of the twelve think at least 30% less. It is most visible on knowledge and instruction-following — MMMLU thinks 65.5% less, MMLU-Pro 57.3%, and IFBench 46.4% with no accuracy cost.
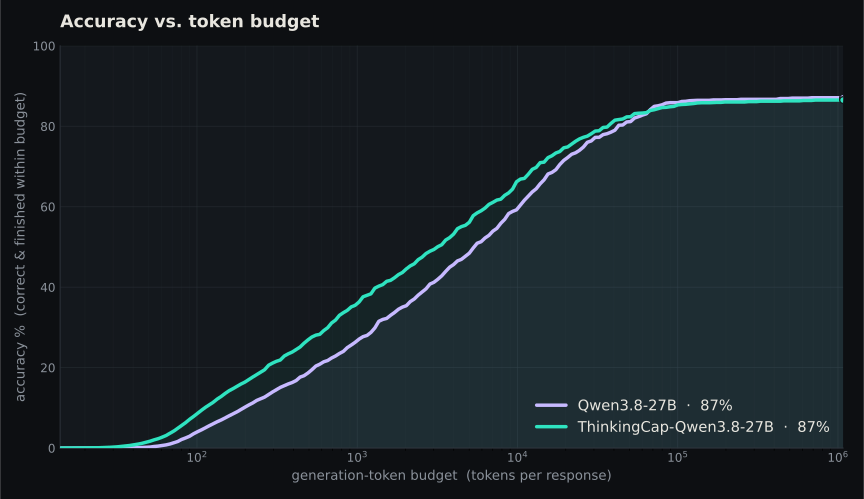
Every response is answered under a cap on how many tokens the model may generate, and one that has not finished by the cap scores nothing. Sweeping that cap from small to large traces out how much accuracy a given budget buys — so the curve answers “if I can only afford B tokens per response, what do I get?”. With a small budget, such as 16K tokens per response, our model is more accurate than the base model.
The headline figure is Δ mean thinking; beside it the table carries Matched Δ thinking, which measures the same shortening a different way.
Δ mean thinking tells you about a total cost. Add up every thinking token a model spends over a benchmark's questions, divide by the number of questions, and that is the figure in Mean thinking tokens. The Δ beside it is how much smaller ours is than the base model's, as a percentage. Because it is built from totals, a question that thinks for thirty thousand tokens counts a hundred times as much as one that thinks for three hundred — which is what you want when the question is what a workload will cost.
Matched Δ thinking works question by question. Take one question, see how many thinking tokens each model spent on it, and write down the change — if ours used half as many, that is -50%. Do the same for every question and average those figures. Each question counts once however long it was, so this is the shortening to expect on a single question rather than across a workload. Those per-question figures are combined with a geometric mean, written out in Evaluation methodology.
Lower thinking modes
Qwen3.8-27B exposes a reasoning-effort setting, and the compression stacks with it. Every number below is measured against one reference: the base model at xhigh. Each setting gets two rows, the base model and ours. The base row shows what the thinking mode setting costs on its own; the gap to our row shows what the ThinkingCap saves on top of that. At medium and low our model gives up roughly a further point of accuracy while cutting mean thinking tokens by another six to eight points. With thinking off the two diverge much further, by 5.7pp.
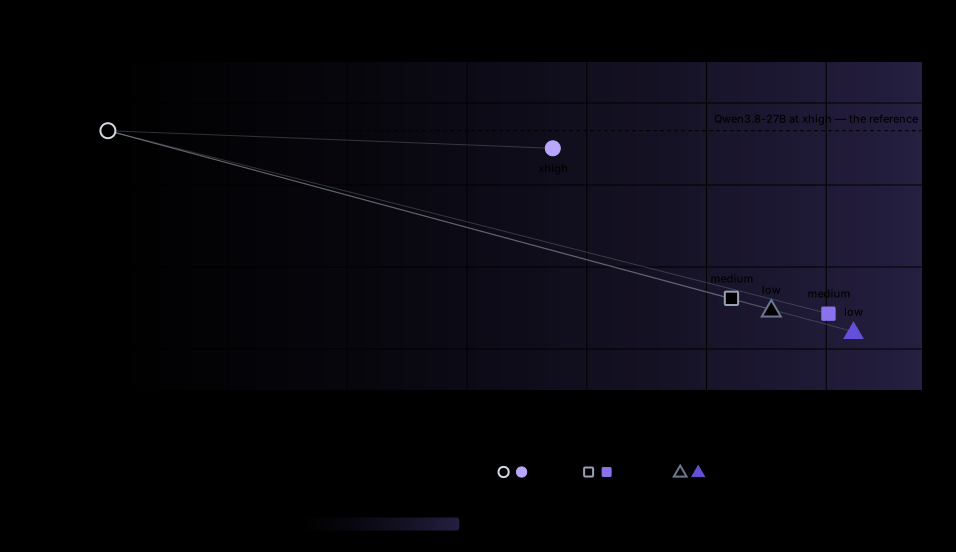
Plotted against each other, the two are not the same trade. The base model's own effort setting buys its shortening steeply: at medium it removes 52% of the thinking and gives up more than eight points of accuracy. Our checkpoint removes 37% at xhigh for under a point, which is the solid circle sitting almost on the reference line. At medium and low it sits seven to eight points further right than the base model at the same setting, for about one more point of accuracy.
| Setting | Model | Rows | Δ accuracy | Mean thinking tokens | Δ mean thinking | Matched Δ thinking | Median thinking tokens | Δ median thinking | Mean answer tokens | Δ mean answer |
|---|---|---|---|---|---|---|---|---|---|---|
| medium | Qwen3.8-27B (base) | 11 | -9.16pp | 10541 → 5830 | -52.1% | -40.3% | 5677 → 2958 | -37.2% | 259 → 386 | +48.8% |
| medium | ThinkingCap-Qwen3.8-27B | 11 | -9.90pp | 10541 → 5042 | -60.2% | -52.1% | 5677 → 2316 | -50.6% | 259 → 350 | +34.9% |
| low | Qwen3.8-27B (base) | 11 | -9.71pp | 10541 → 5461 | -55.4% | -45.8% | 5677 → 2704 | -42.3% | 259 → 393 | +51.6% |
| low | ThinkingCap-Qwen3.8-27B | 11 | -10.79pp | 10541 → 4779 | -62.3% | -55.4% | 5677 → 2171 | -53.3% | 259 → 351 | +35.3% |
| thinking off | Qwen3.8-27B (base) | 11 | -28.57pp | 10541 → 5 | -100.0% | — | 5677 → 0 | -100.0% | 259 → 1963 | +656.6% |
| thinking off | ThinkingCap-Qwen3.8-27B | 11 | -34.25pp | 10541 → 7 | -100.0% | — | 5677 → 0 | -100.0% | 259 → 1387 | +434.6% |
The same benchmarks as above without tbench2.1, which ran only at xhigh. Every cell is a macro average across the eleven, not a single benchmark. Every Δ is measured against the base model at xhigh, so a pair of rows is read against itself: at medium the base model gives up 9.16pp of accuracy and ours 9.90pp, for 52.1% and 60.2% fewer mean thinking tokens. The thinking-off rows carry no matched figure — with the reasoning gone there is nothing left to pair on — so read the answer column there instead.
Does that hold on a single benchmark, or only on the average? Nine of the eleven, one panel each, grouped by task family. The x axis here is the Matched Δ thinking column from the tables rather than the batch figure the chart above plots — per benchmark that is the honest comparison, and it is why these percentages run larger:
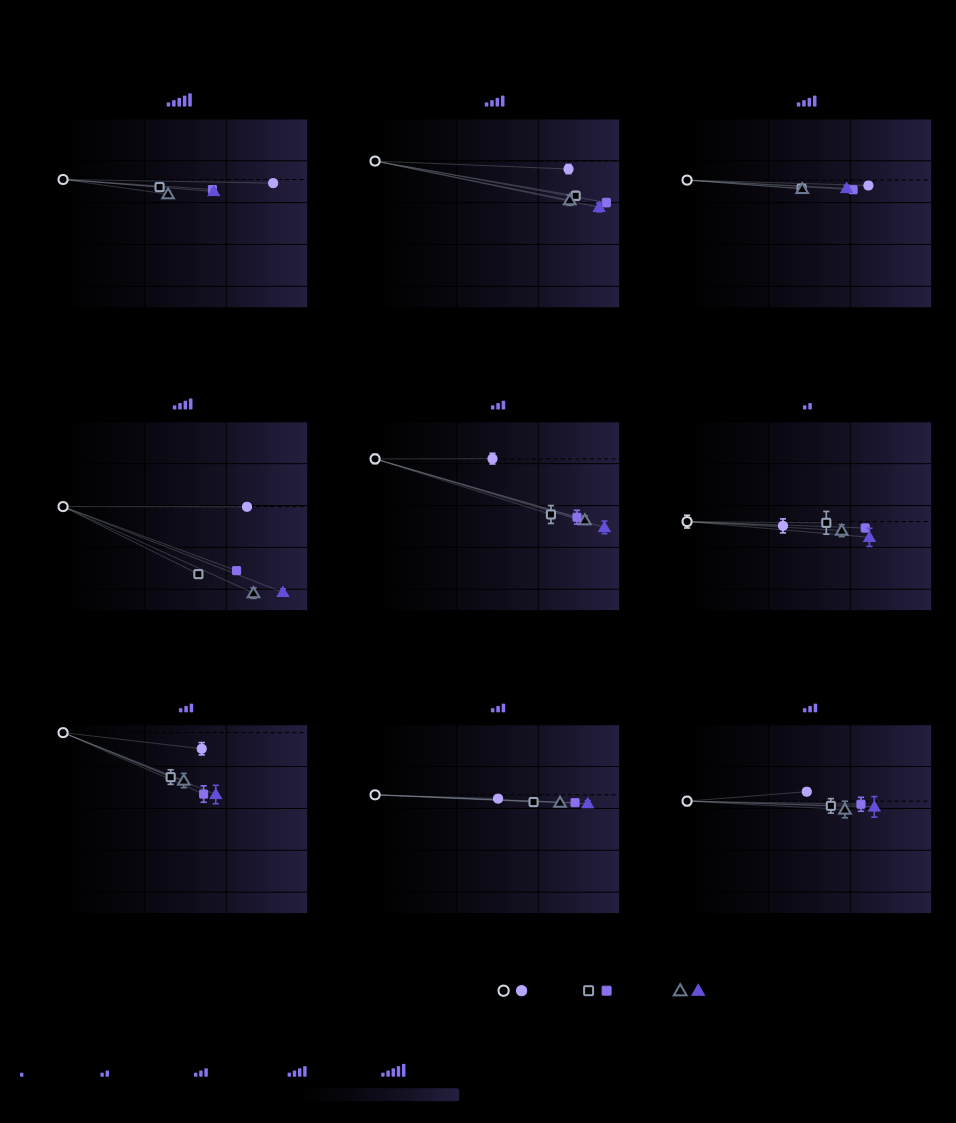
The horizontal result repeats everywhere: at every setting, on every one of the nine, our curve sits to the right of the base model's — the effort dial and the ThinkingCap are cutting different things. What the panels add is that the vertical cost is not uniform. On AA-LCR our curve sits above the base model's at every setting, so there the shorter answers are also the better ones, and on IFBench the two are level. On MMLU-Pro, MMMLU, RealWorldQA and LiveCodeBench they never part by more than two points at the same setting. AIME 2026 is where the trade is most expensive, at three to four points at every setting.
Evaluation methodology
Reasoning models are noisy to evaluate. At the recommended sampling temperature of 1.0 both the content and the length of a response move run to run, so a single seed tells you very little. Everything below is full benchmark datasets — no subsets — with multiple seeds per benchmark and accuracy reported as the mean with a 95% confidence interval across seeds.
Both sides are the same run. The base model and ours were evaluated by the same harness, on the same hardware, with identical sampling and serving settings, at the same reasoning effort. The configuration:
- Harness — our internal evaluation suite, running both models on vLLM 0.29.0.
- Hardware — one H200, bf16 KV cache.
- Context — 262,144-token served window; generation capped at 253,952 tokens (131,072 on AA-LCR, 65,536 per turn on τ²-bench). The caps are far above what either model actually uses.
- Sampling — temperature 1.0, top_p 0.95, top_k 20, min_p 0.0, identical for both models. Ours inherits the base model's sampling card, so no part of the comparison is a decoding change.
- Reasoning effort —
xhighon both sides for the headline table. - Speculation — MTP k=3, which we measured to be accuracy-neutral (AIME26 over 32 seeds: 98.23% without speculation, 98.13% with).
- Accuracy — the mean across seeds with a 95% confidence interval. MMLU-Pro and MMMLU run at a single seed and carry no interval: with 12,032 and 9,996 questions their binomial noise is around ±0.3pp, but a single seed says nothing about run-to-run variation.
- Seeds — 32 on AIME26; 4 on tbench2.1; 16 on HMMT Feb 26, HMMT Nov 25, GPQA-Diamond and IFBench; 8 on LiveCodeBench, RealWorldQA, AA-LCR and τ²-bench; 1 on MMLU-Pro and MMMLU, whose question counts are large enough (12,032 and 9,996) that question sampling is not the limiting noise.
What the columns mean
Both tables use the same names.
- Seeds — independent sampling runs of the benchmark.
- Accuracy (base) / Accuracy (ours) — as above; Δ accuracy is the difference between them, in percentage points.
- Matched Δ thinking — the change in thinking tokens, paired on the question and aggregated as a geometric mean of the per-question ratios. Written out below.
- Thinking tokens are the tokens before the reasoning closes, answer tokens those after it, total tokens both together. Each is written
base → ours, and the Δ beside one is that benchmark's own percentage change. - Truncated % — the share of responses whose thinking never closed, which score zero. Looping % — the share caught by a compression-based loop detector.
How the matched Δ is computed. Each side's token count is averaged over its seeds first, so a question has one value for the base model, , and one for ours, . The column is then
over the questions both models answered. A question where has no logarithm and drops out of this column alone — which is why the thinking-off rows carry no matched figure at all.
Get the model
The model is at bottlecapai/ThinkingCap-Qwen3.8-27B, with GGUF, FP8 and NVFP4 builds published alongside it.
Download it, use it, try to break it, and tell us what you find. It is not always about the newest model — quite often it is about making the model you already run cost less to run.
Contact us
Enterprise fine-tuning: medium and low effort
Inference providers. Shorter traces mean more requests per GPU-hour and a cheaper tier to price against — without shipping a smaller model.
Analytics and BI. Text-to-SQL and metric lookups: high volume, narrow schema, answers that are right or wrong. Repetitive reasoning is the easiest kind to compress.
Prove it on your own data
ThinkingCap-Qwen3.8-27B is trained at xhigh, but medium and low effort are where enterprise traffic actually runs — and that is where we fine-tune. You get a variant tuned to your effort tier and your workload, proven against your own evals before you commit.
Bring us your traces and your benchmark: enterprise@bottlecapai.com